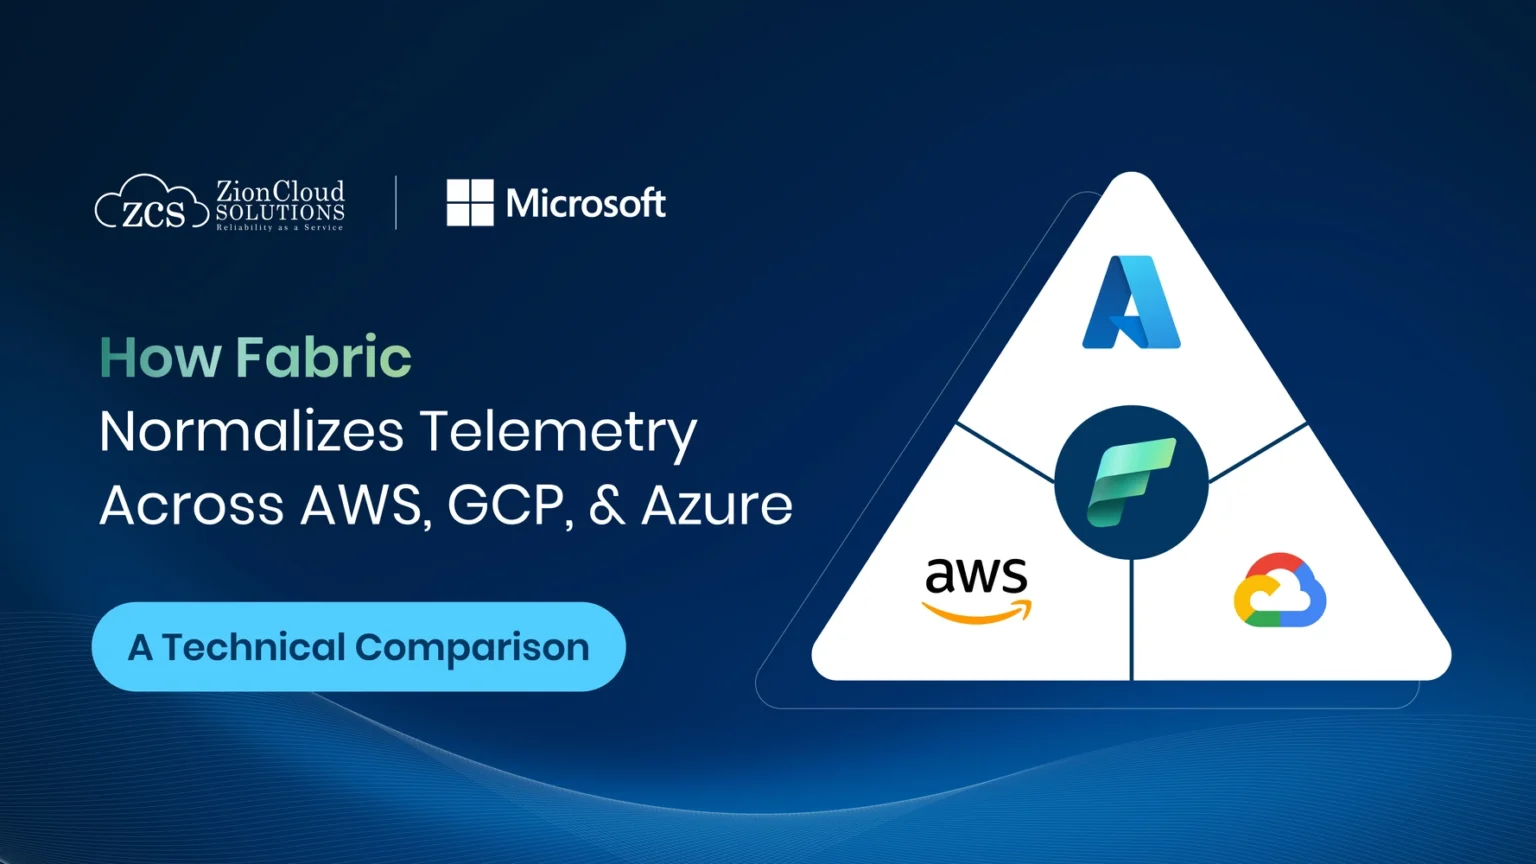
If you’ve ever tried to build a single observability view across AWS, GCP, and Azure, you already know the reality: the clouds speak completely different languages. Each cloud provider exposes telemetry in its own structure, with distinct naming conventions, custom metadata, unique log formats, and incompatible trace models. Trying to correlate these signals manually often feels like assembling a puzzle with mismatched pieces. Engineers spend countless hours just trying to interpret data that should have been aligned from the start.
This is exactly why an Observability Fabric has become essential. It doesn’t just collect telemetry; it transforms it, enriches it, aligns it, and makes it possible for engineering teams to see the entire system as one coherent whole. The question is; how does this fabric actually normalize telemetry across three clouds that were never designed to interoperate? And what does this normalization process look like at a technical level?
Let’s break it down and understand.
Why Multi-Cloud Telemetry Normalization Has Become a Critical Challenge
Organizations today rarely depend on a single cloud. Workloads shift across providers based on cost, performance, compliance, and ecosystem fit. While multi-cloud strategies introduce flexibility, they also introduce significant observability of pain. AWS, GCP, and Azure each rely on different metric namespaces, log schemas, trace formats, and resource identification models. Even something as basic as CPU utilization is expressed in three different formats across the three platforms. This inconsistency makes troubleshooting slower, performance tuning harder, and cost optimization nearly impossible.
The only way to solve this problem is through a unified layer that sits above the cloud-specific complexities. This is the role of an Observability Fabric: a system that ingests raw telemetry from every cloud source and converts it into a normalized, enriched, and correlated representation that supports consistent analysis and insight.
The Telemetry Gap Between AWS, GCP, and Azure
To appreciate the fabric normalization process, you must understand how different the raw signals from the three clouds really are. AWS delivers telemetry primarily through CloudWatch, where metrics are grouped into namespaces such as AWS/EC2 or AWS/Lambda. These metrics often rely on dimensions like Instanced and may include nested JSON logs that vary widely by service. Traces usually originate from AWS X-Ray, which has its own naming patterns and conventions.
GCP, on the other hand, uses Cloud Monitoring, formerly Stack driver, and follows a more hierarchical naming approach. Metrics often resemble compute.googleapis.com/instance/CPU/utilization and come packaged with strictly defined labels. Logs follow Google’s Log Entry structure, while tracing relies on Google’s proprietary format.
Azure relies on Azure Monitor, where metrics use verbose resource identifiers such as Microsoft. Compute/virtual Machines/Percentage CPU. Logs are deeply tied to the Kusto Query Language (KQL) schema, and tracing is handled through Application Insights with its own correlation model.
These differences create a fragmented picture of system behavior. Without normalization, engineers often need three different dashboards and three different mental models to understand what’s happening across their cloud footprint.
How the Observability Fabric Brings Order to Multi-Cloud Telemetry
An Observability Fabric operates like a translation engine. It begins by ingesting signals from all cloud-native sources, then applies a sequence of structured transformations to unify the data. This normalization is the heart of the fabric, and it involves several technical layers.
The first layer is metric normalization. Metrics from AWS, GCP, and Azure arrive with different names, labels, and units. The fabric maps each metric to a conventional naming system, typically based on Open Telemetry semantic conventions. It converts varying naming styles into a unified taxonomy. After passing through the fabric, each of these becomes a consistent identifier that downstream tools can understand without special handling.
The fabric also standardizes dimensions and attributes. Instanced in AWS, instanced in GCP, and Resourced in Azure ultimately become a single normalized key such as resource.id. This alignment makes correlation queries significantly more intuitive. Instead of writing three different queries for three clouds, engineers can use one query pattern across the entire system.
Log Normalization: Transforming Chaos into Clarity
Logs are often the messiest signal in the observability ecosystem, especially in a multi-cloud environment. AWS logs frequently come in nested JSON structures; GCP logs adhere to the Log Entry format, and Azure logs are tightly tied to the Kusto schema. An Observability Fabric parses these log structures using both deterministic and AI-assisted methods. It identifies timestamps, severities, service identifiers, request metadata, and fields that may not be consistently named across the clouds. The fabric then restructures these logs into a uniform schema. This makes cross-cloud log correlation dramatically easier, particularly during incident response.
Another crucial step is severity normalization. Different clouds use different severity labels or numeric levels. By converting them into a single severity taxonomy, the fabric ensures that alerting, filtering, and triage processes behave consistently.
Trace Normalization: The Hardest Part of the Fabric
Tracing is by far the most challenging type of telemetry to normalize. AWS X-Ray uses its own trace identifiers, span formats, and annotations. GCP’s trace model is based on Google’s internal systems. Azure Application Insights uses a slightly different correlation scheme. These trace formats cannot be correlated directly.
The Observability Fabric addresses this by converting all incoming traces into the Open Telemetry span format. This process involves remapping span attributes, standardizing names, unifying span statuses, and generating a single trace structure that can represent a request flowing across multiple clouds. Once normalized, engineers can finally follow a request across AWS Lambda, GCP Cloud Run, and Azure Functions without losing context.
Why a Unified Telemetry Model Matters for Engineering Teams
When telemetry is normalized, multi-cloud observability transitions from a confusing puzzle into a coherent engineering system. Dashboards have become universal. Alerts become predictable. Root cause analysis becomes faster. Data science and AI workloads gain consistent inputs. And engineers no longer waste hours deciphering cloud-specific terminology that obscures the actual problem.
A fabric provides no single cloud can: a unified view of distributed systems. It allows engineers to understand behavior, performance, and reliability across the entire organization without switching tools or translating data.
Wrapping Up
As organizations continue adopting multi-cloud strategies, telemetry fragmentation will only grow more complex. AWS, GCP, and Azure will continue to evolve their telemetry formats independently, and engineering teams will continue to feel the pressure. An Observability Fabric offers a way out of this chaos by providing a uniform, consistent, and intelligent normalization layer that turns incompatible signals into actionable data.
If your teams are tired of managing three different observability models and want a unified way to understand system behavior across all clouds, the next step is clear: invest in a fabric that brings everything together.


